Bar reports by structure
By tapping on the pie chart, in the Reports tab you can access a bar graph screen, corresponding to the selected report and child.
By default, bar charts are displayed with activities grouped by days. By tapping on the top selector, we can show the activities grouped by structure.
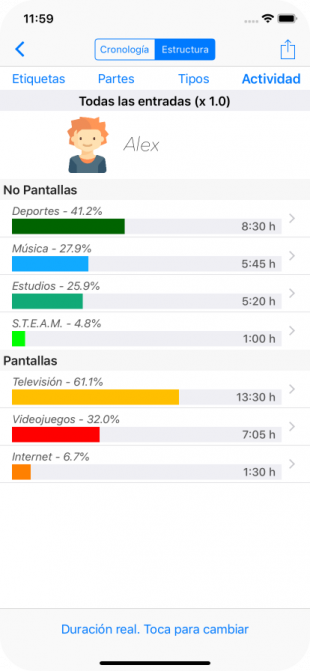
When selecting Structure, the default screen will show the bar chart of the durations of the activities grouped by Activity (groups of), each with its own color. These colors can be customized in the creation / edition of the Activity.
The activities are classified in the two large blocks: green ones (non-screens) and red ones (screens), indicating the percentage of time of each activity over the total in each of the main blocks.
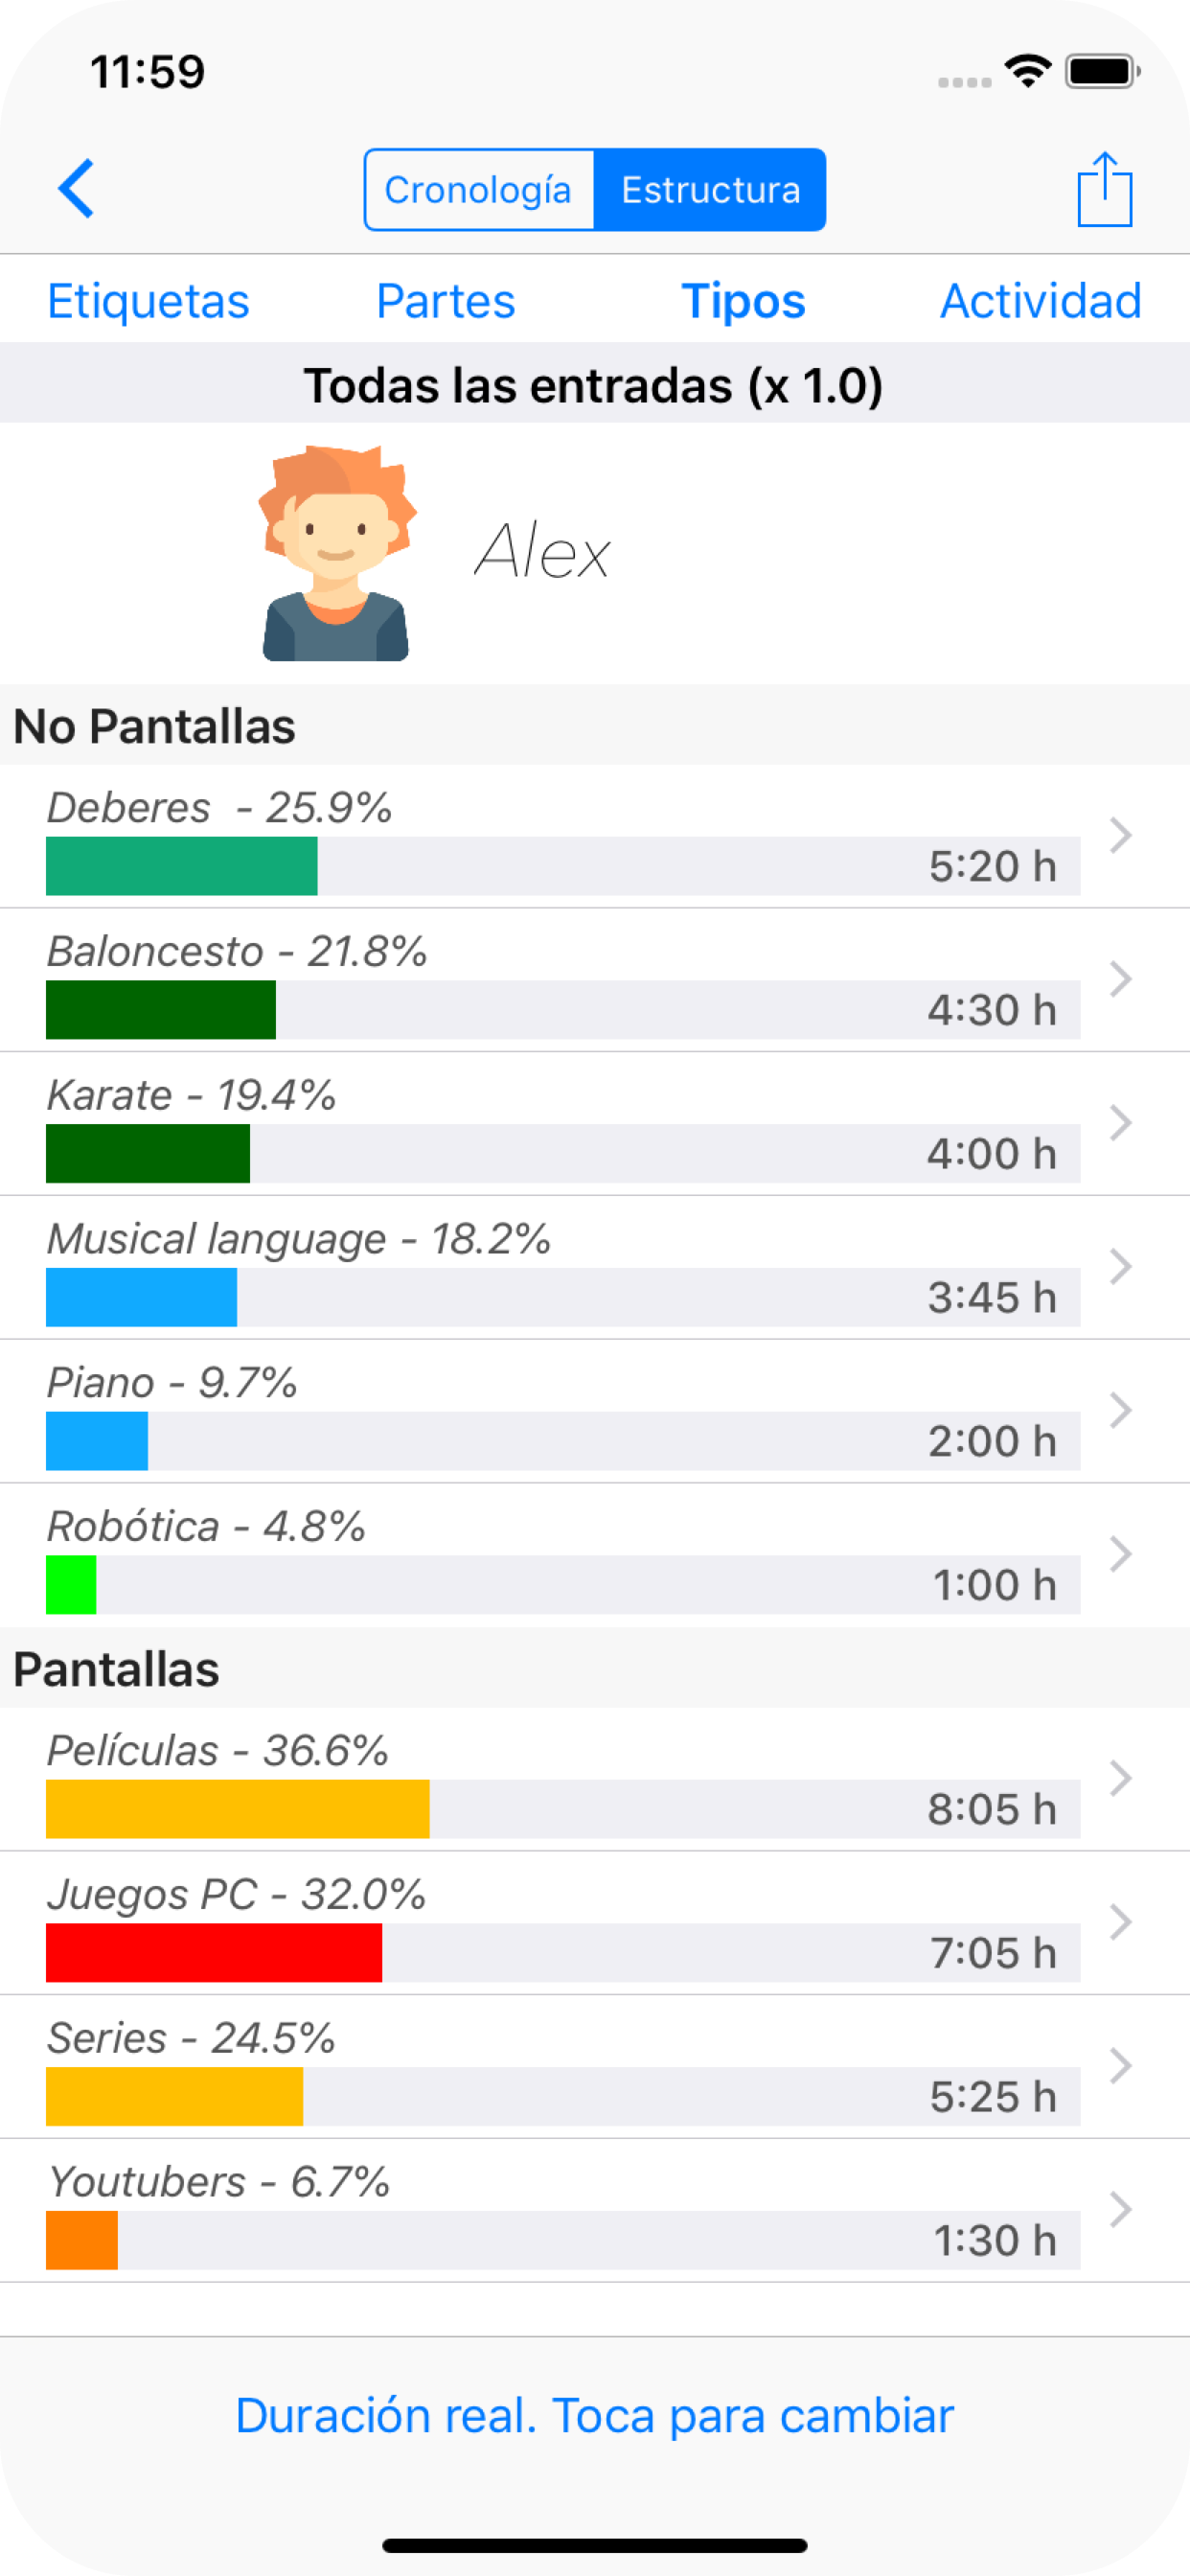
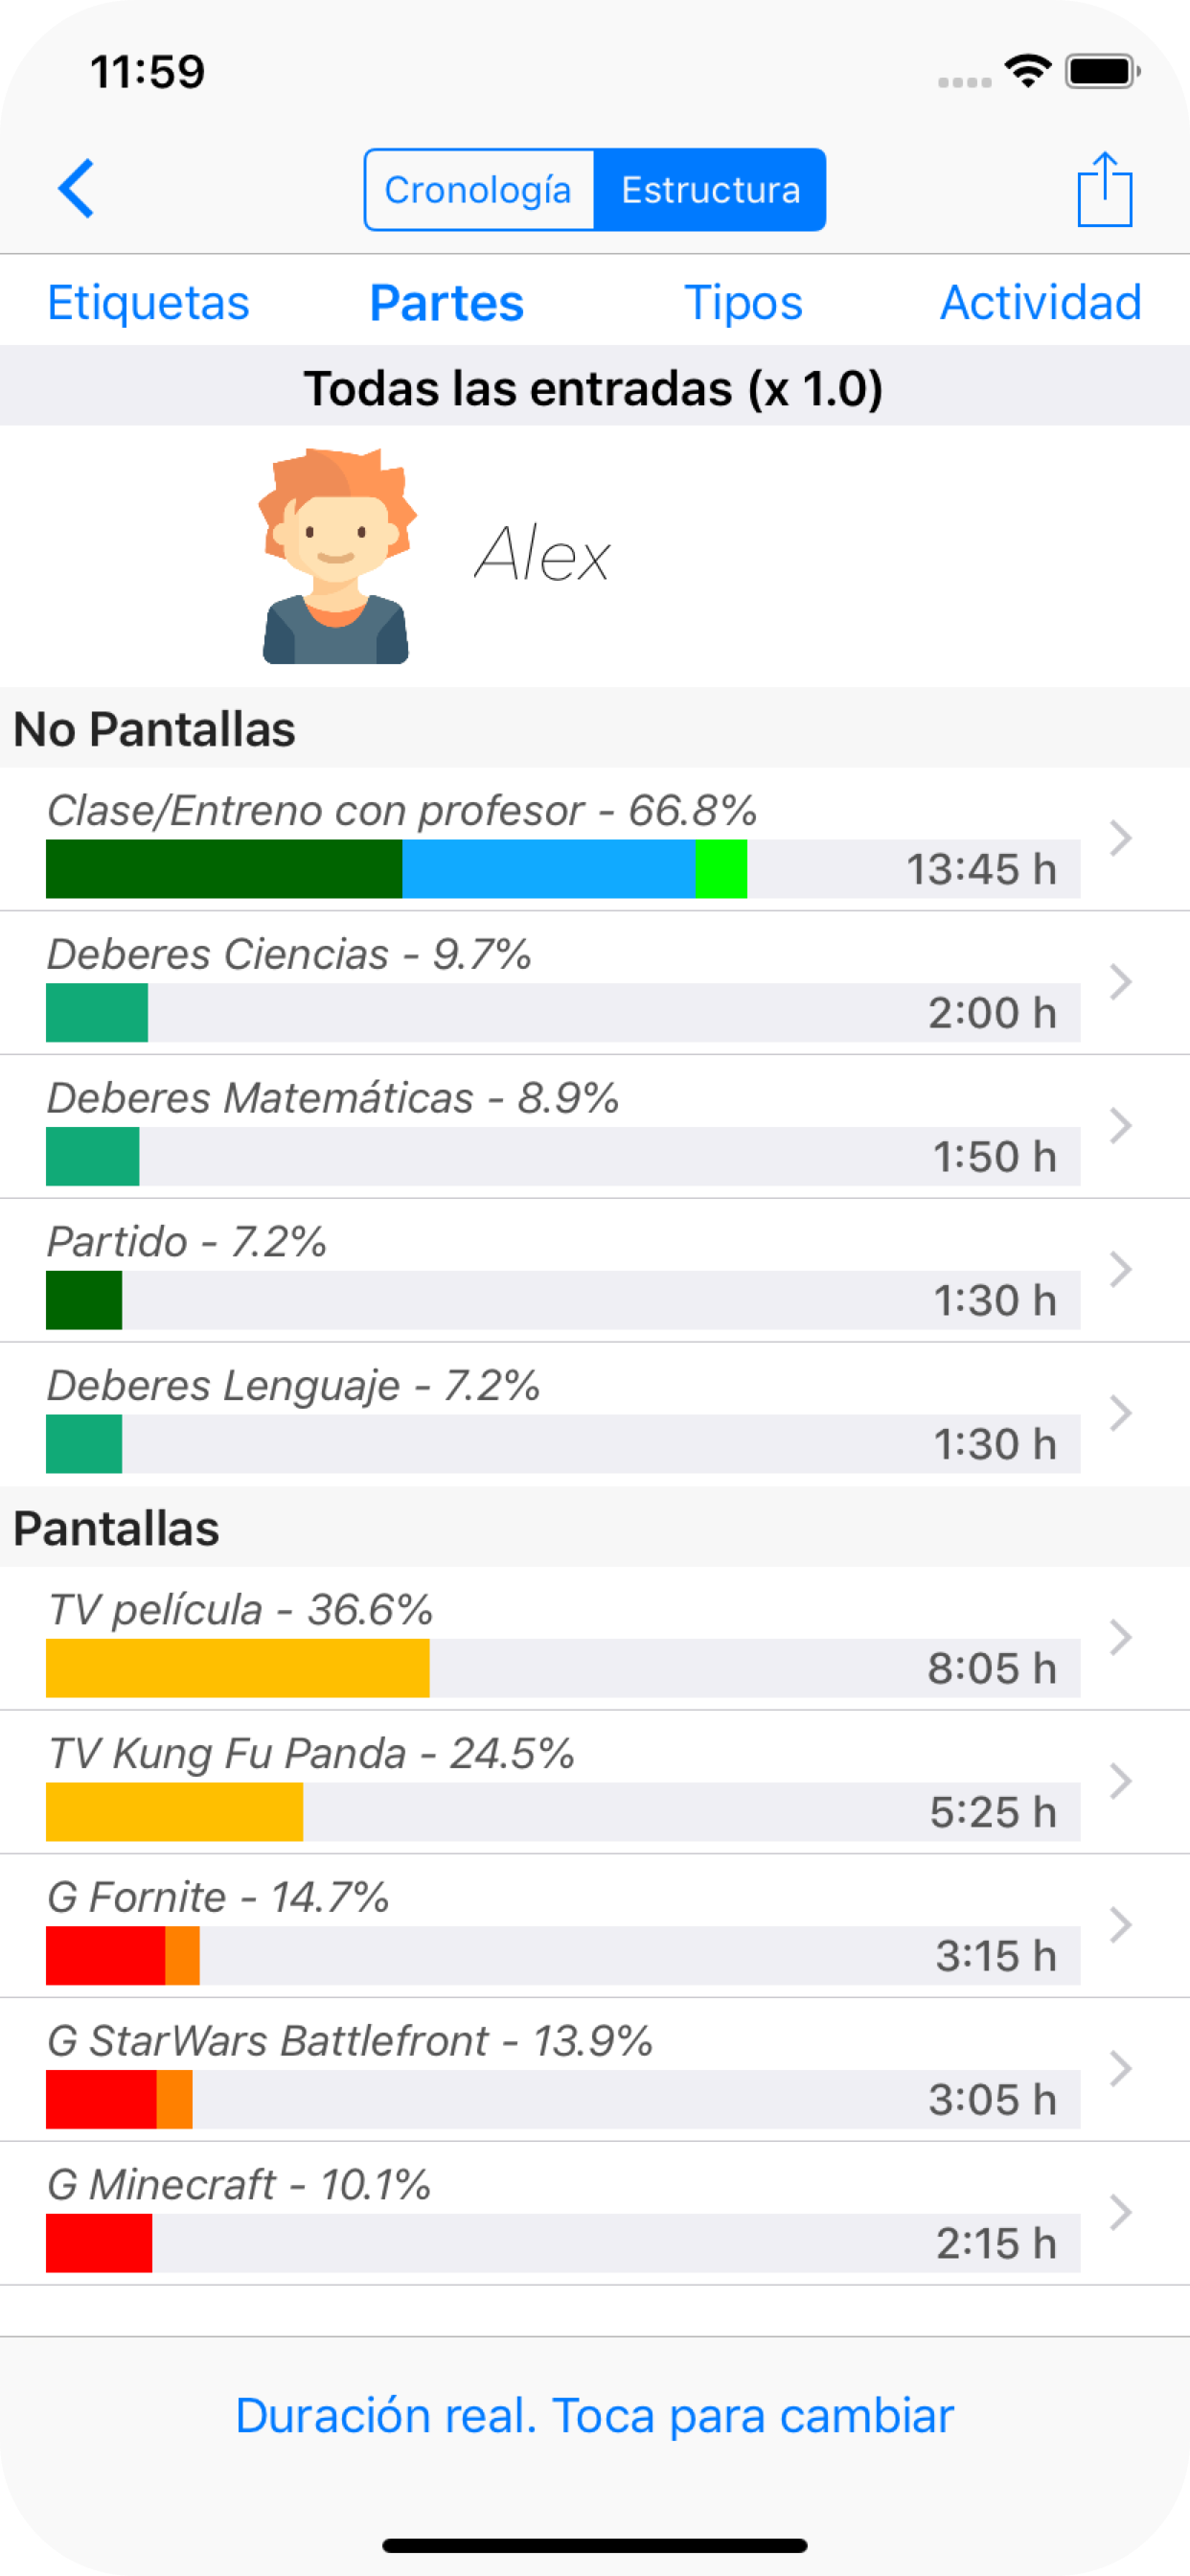
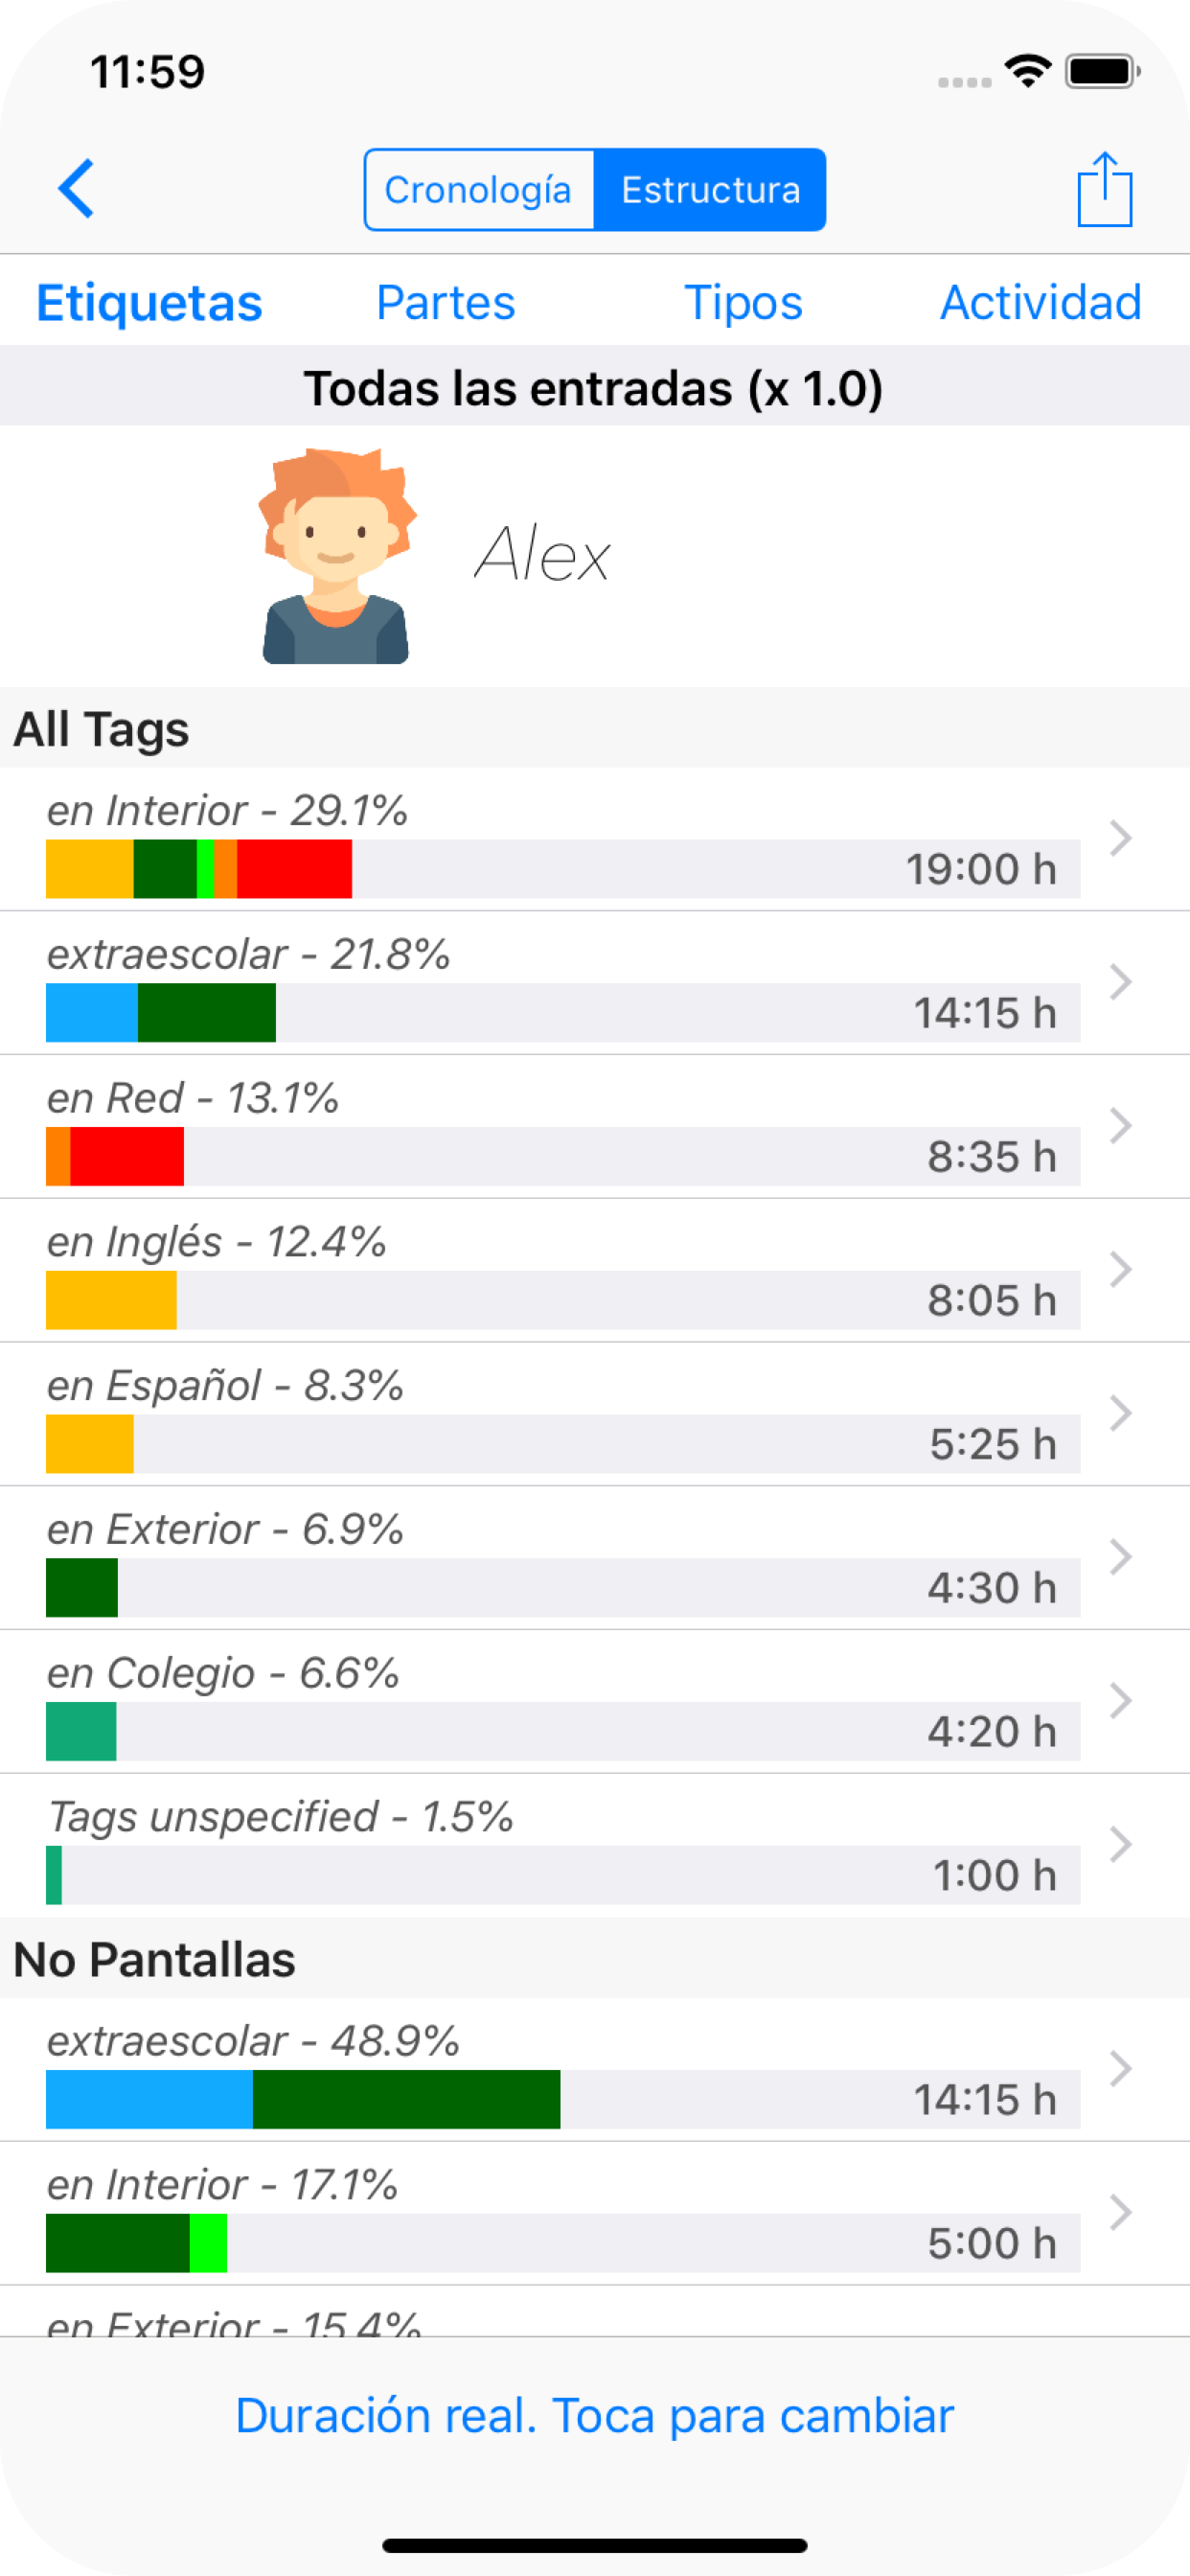
If the advanced mode of the application is activated, in addition to the view by Activity (group of), we can select views of activities grouped by activity Types, Parts and Tags, as shown in the images below.
Tapping on a specific bar we select the activities of that group and a second level of filtering is shown. The "<" button in the upper left allows us to go back to the previous level. It is only possible to filter to a depth of 5 levels.
Others views of reports by structure, depending on the user's selection.
Structure: Types

Structure: Parts

Structure: Tags

