Bar reports by time periods
By tapping on the pie chart, in the Reports tab you can access to this bar-chart screen, corresponding to the selected report and child.
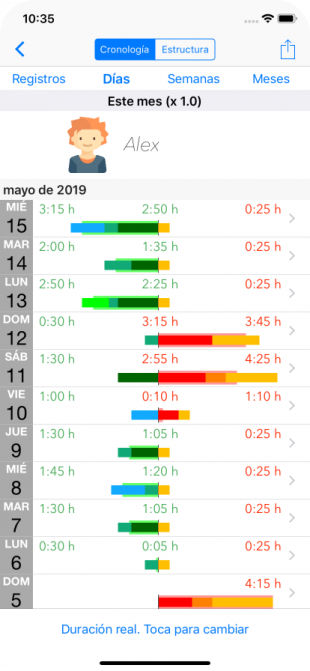
By default, bar-charts are displayed with activities grouped by days.
With a thin bar, on the left are the activities that are classified as green (usually non-screens), and on the right the activities classified as red (screens).
A thicker bar shows the balance between the sum of the green activities and the sum of the red activities.
The background color of this thicker bar is light green or light red, depending on whether the total time of the green activities or that of the red activities is longer
By tapping on a specific day we select the activities of that day and a second level of filtering is shown. The "<" button in the upper left allows us to go back to the previous level. It is only possible to filter to a depth of 5 levels.
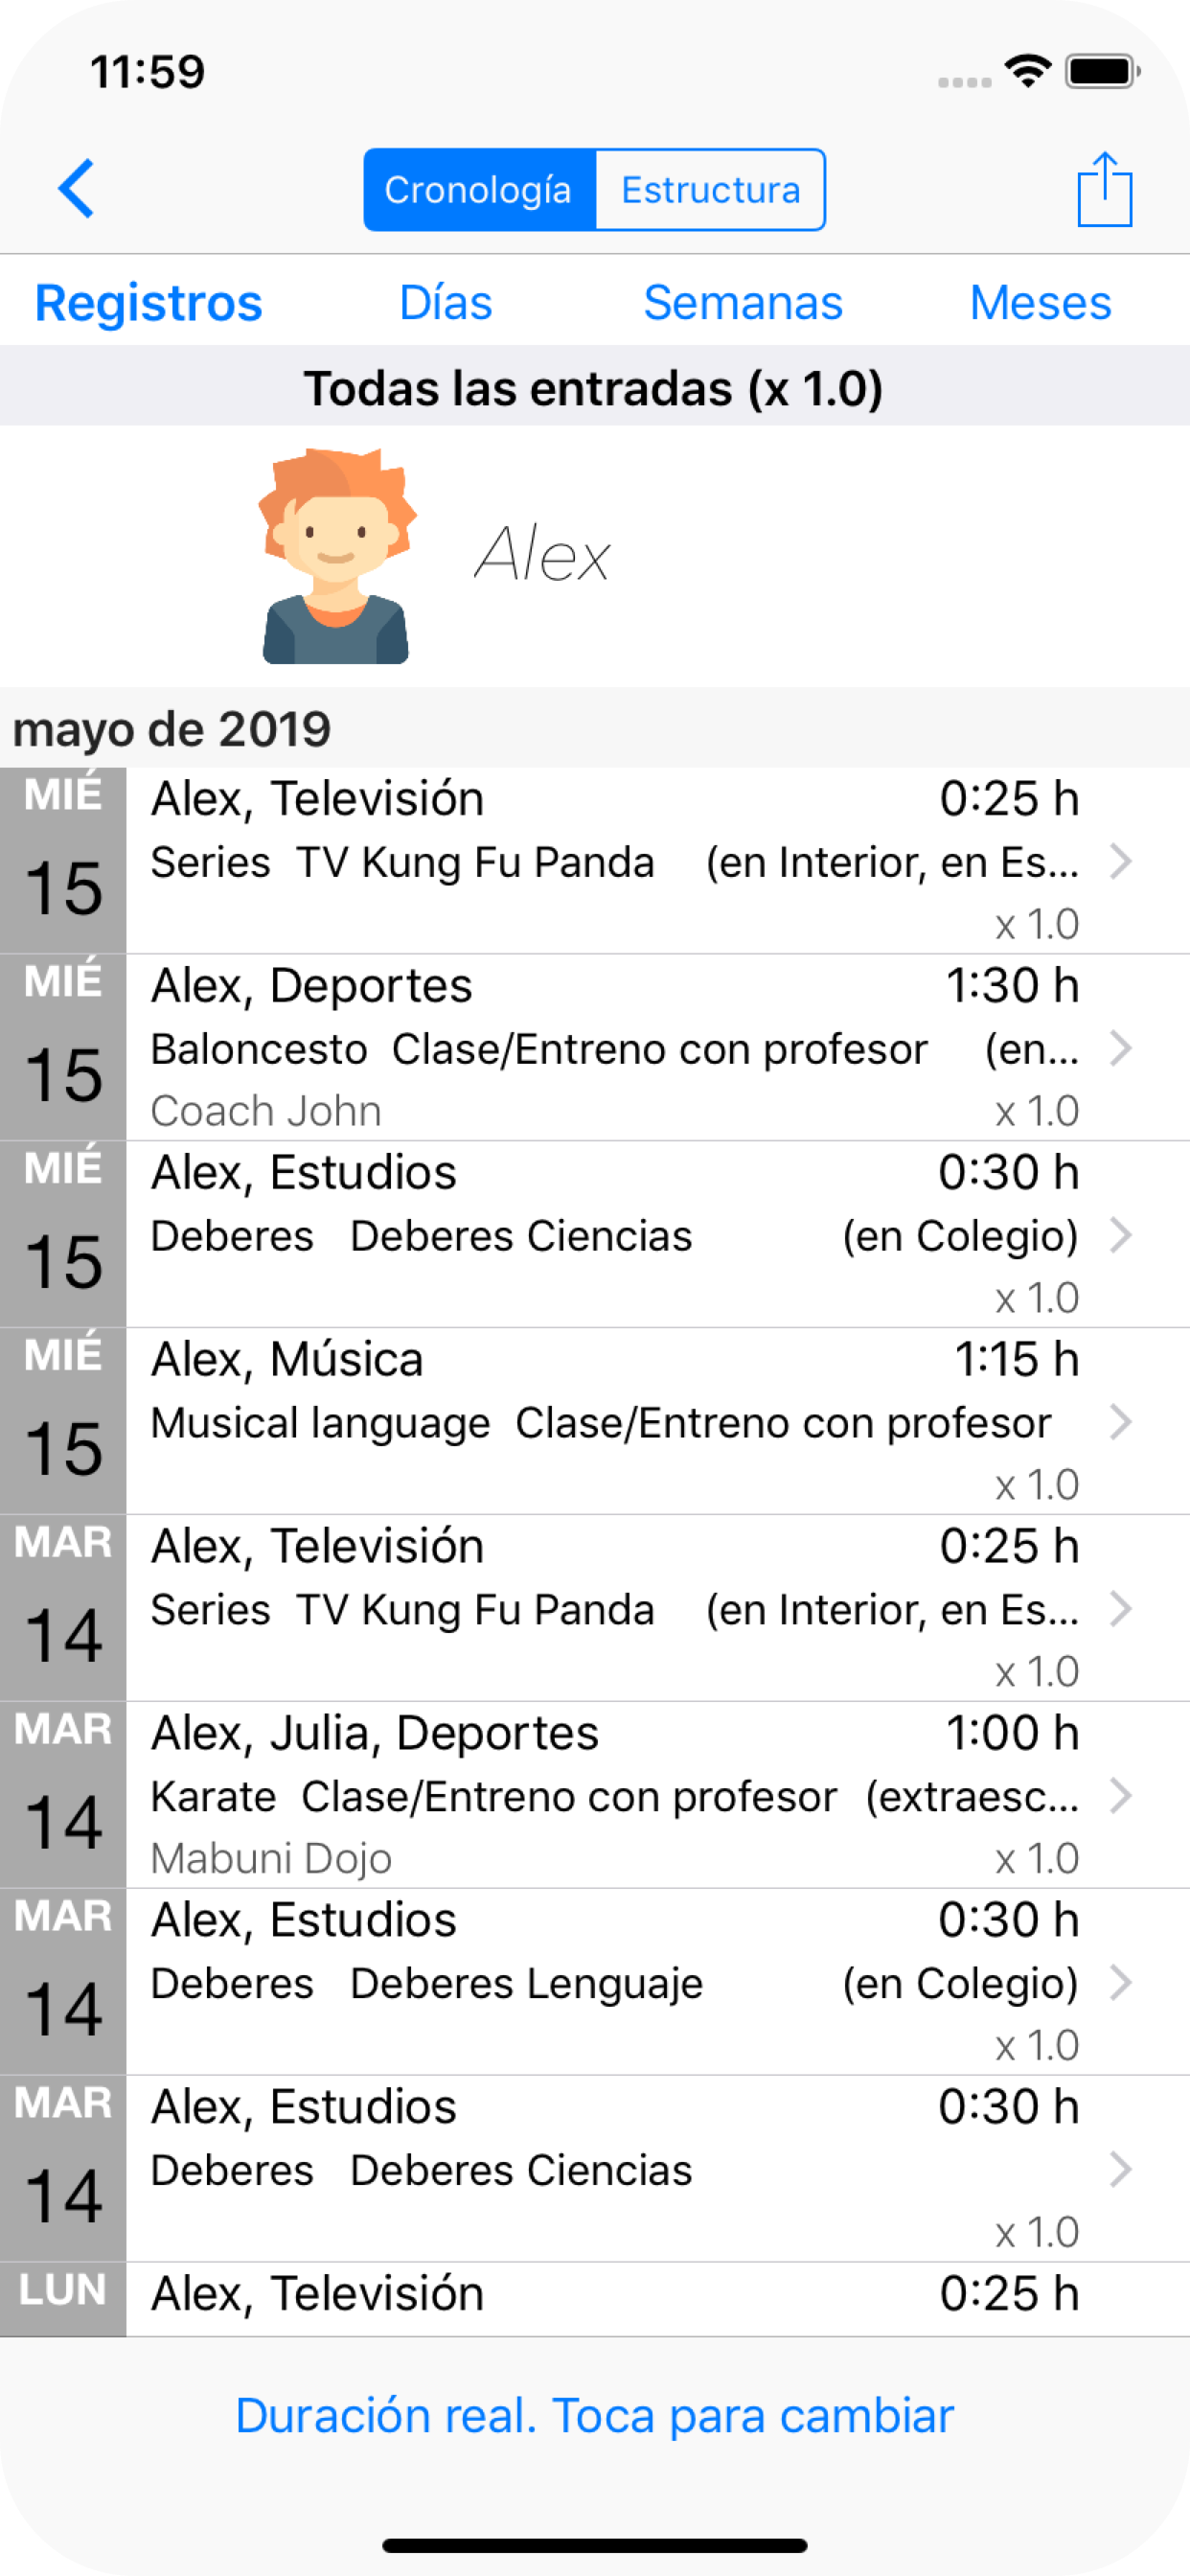
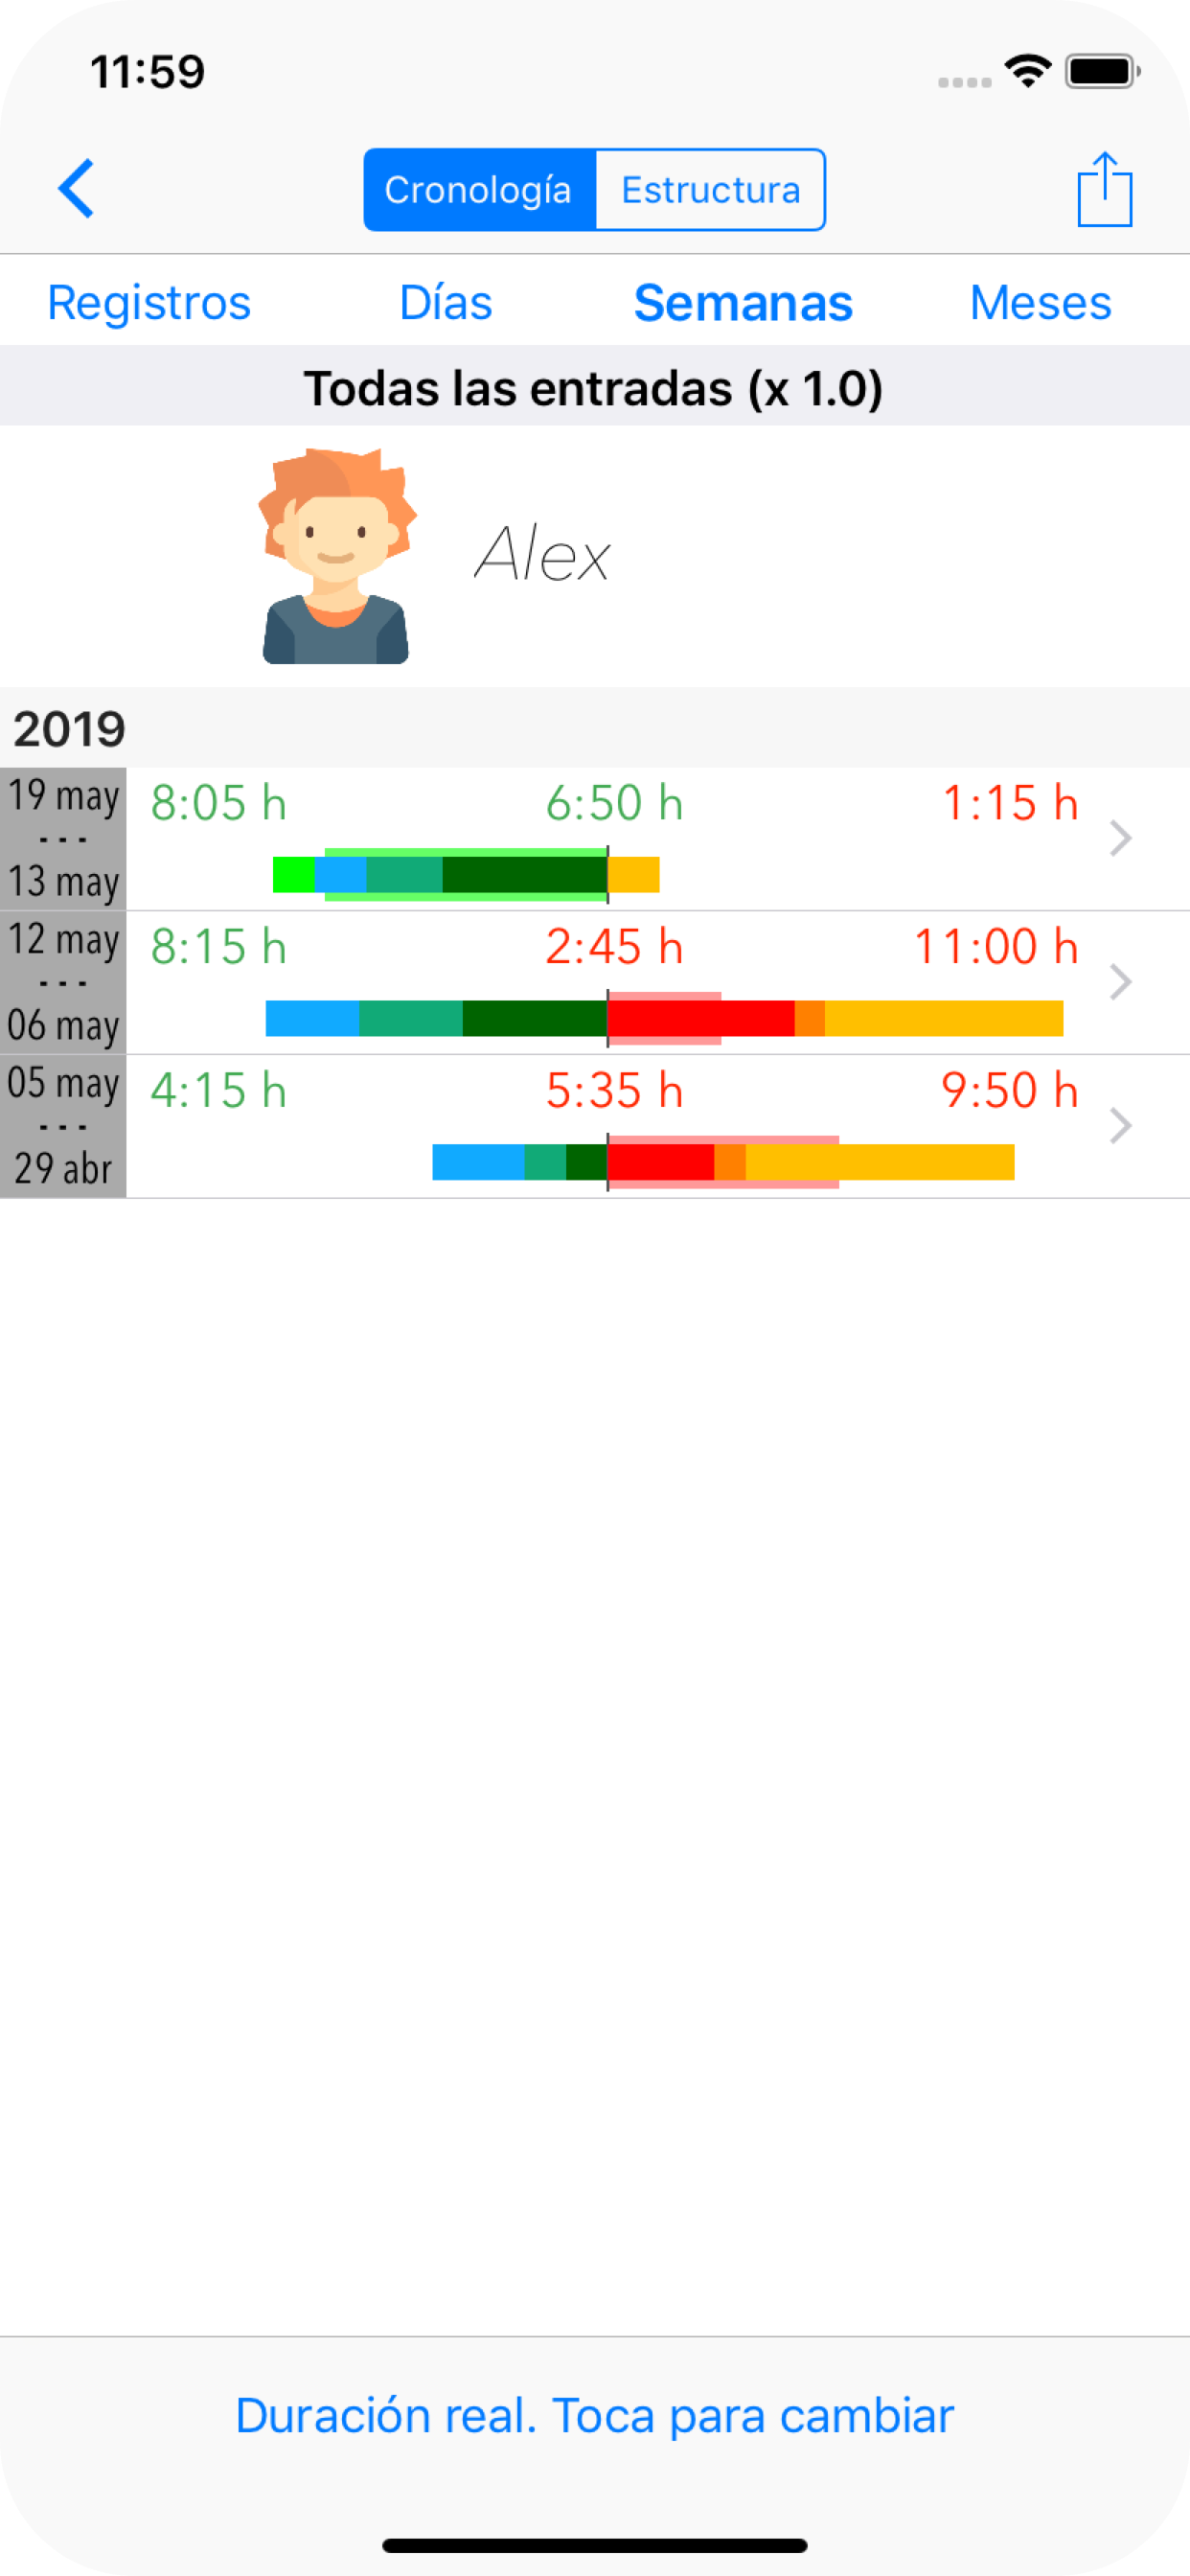
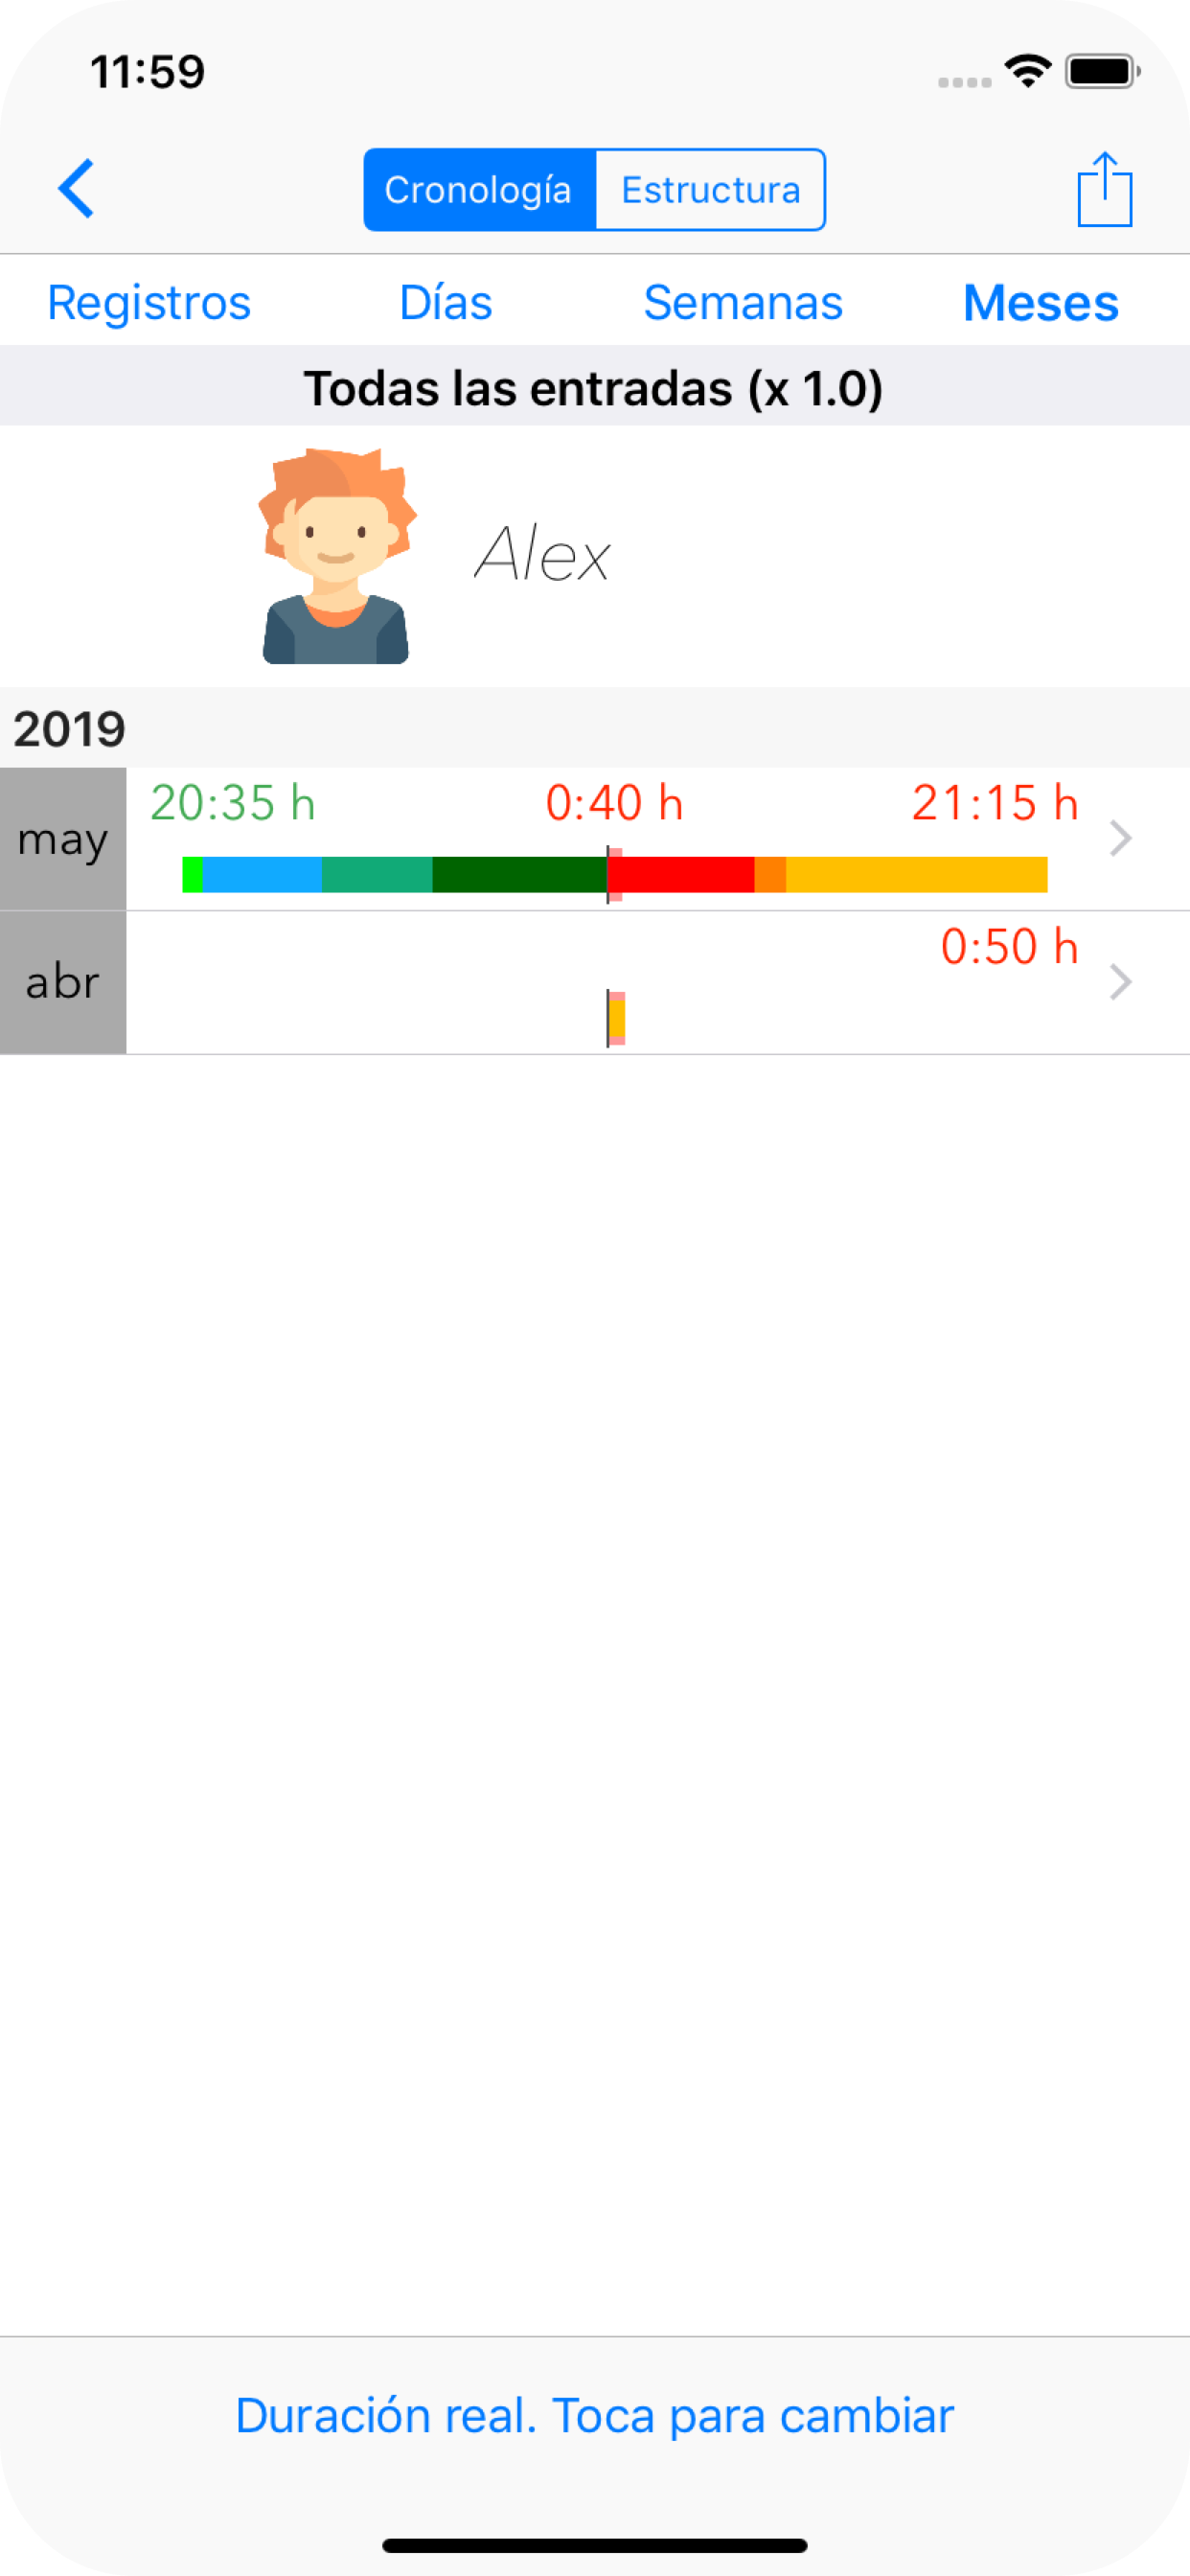
We can select views of activities grouped by weeks, months or see the list of activities entries ordered temporarily.
Below, report views for periods of time, depending on the user's selection.
Cronology: Registers

Cronology: Weeks

Cronology: Months

