Reports
In the "Report" tab you can access the view that will allow us to select the type of report we want to generate and which boy or girl. The graphics we generate are always from a single child.
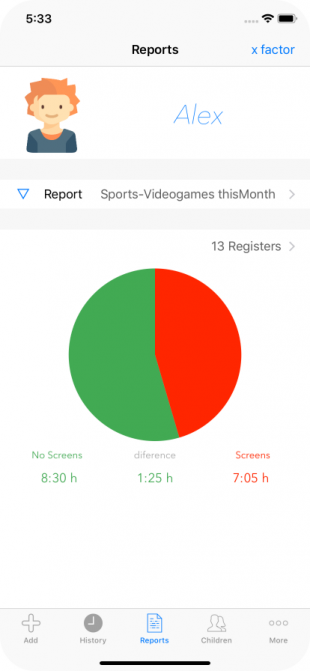
This screen consists of three blocks of information.
The first block, at the top, shows us a name and an image of a boy or girl. By default, the one that appears first in the list of children in the Children tab is displayed. By tapping on the name or the triangle-shaped button down, we will display a selector in which we can select another child, among which we have assets within our application (children who have been deactivated do not appear visible in the selector).
A second block, below the name of the selected child, indicates the name of the Report that is selected. By default, the first report is shown selected from the list of reports that we have in the application. By tapping on the name of the report (your cell), a screen opens with the list of all existing reports, so that we can select any other of the existing reports.
In this second block, the triangle icon on the left of the name of the Report, displays the properties of the selected report. This allows us to see what filters the report applies and also allows us to modify it at our convenience, as a quick filter.
The third block of the page, below the name of the report, shows the result of applying the filters of the selected Report on the activity entries of the selected Child.
In a first line it indicates the number of entries / records that have been selected.
Then it shows us in the form of a pie chart the value of the duration of the activities of the selected records when applying the report, taking into account whether they are activities classified as green or as red.
Below the graph, the total time of the activities that are classified as green (in green color), the total time of the activities that are classified as red (in red color) is shown, and among them, the difference between the two values previous, red if red activities exceed green, and green if it happens the other way around.
Touching on any of the elements of this third block (the pie chart, or the number of records) you enter the bar graph screens, corresponding to the selected report and child.
